> ## Documentation Index
> Fetch the complete documentation index at: https://docs.celesto.ai/llms.txt
> Use this file to discover all available pages before exploring further.
# Tracing and Observability
> See every Agentor run in the Celesto dashboard — model calls, tool calls, timings, and token counts — once you opt in.
## What tracing gives you
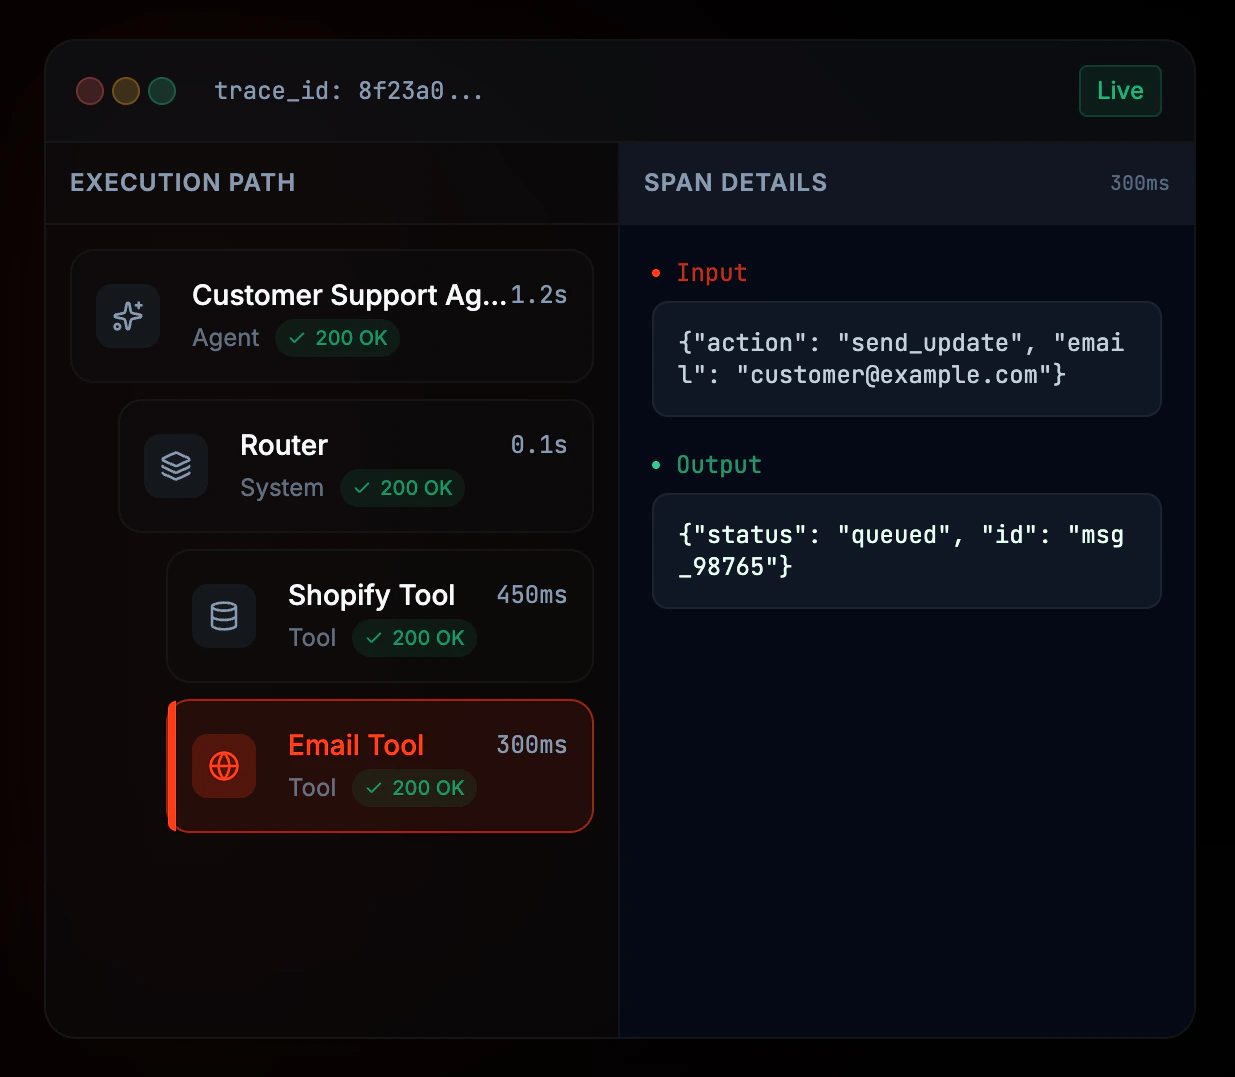
A trace is a recording of one agent run. Turn it on and every run shows up in the Celesto dashboard, so you can:
* Follow an agent step by step instead of guessing from logs
* See what each tool was given and what it returned
* Find the slow step, and the expensive one
* Tell a failed run from one that quietly ran out of turns
 Tracing is opt-in. A trace carries prompts, tool arguments, and tool results, so nothing leaves your process until you ask for it — a Celesto API key alone does not enable it.
***
## Quick setup
Add your Celesto API key to the environment. Get one from the [Celesto dashboard](https://celesto.ai/dashboard).
```bash theme={null}
export CELESTO_API_KEY="cel_..."
```
Pass `enable_tracing=True` when building the agent. Every run it makes is then recorded.
```python theme={null}
from agentor import Agentor
agent = Agentor(
name="Support Agent",
model="gpt-5-mini",
enable_tracing=True,
)
result = agent.run("Summarize the latest support tickets.")
```
Agentor raises with a clear message if `enable_tracing=True` is set without `CELESTO_API_KEY`, rather than silently doing nothing.
Open [celesto.ai/observe](https://celesto.ai/observe) and confirm the trace appears.
You should see one trace per run, with a span for each model call and each tool call.
## Trace one run
`tracing=` on the call overrides whatever the agent was built with. Use it to exempt a sensitive input from an otherwise-traced agent, or to record a single call from an agent that normally does not:
```python theme={null}
# Agent has tracing on — skip this one call.
agent.run("Contains customer data", tracing=False)
# Agent has tracing off — trace just this call.
debug_agent = Agentor(name="Debug", model="gpt-5-mini")
debug_agent.run("Why is this failing?", tracing=True)
```
Pass `None` (the default) to keep the agent's configuration. `tracing=` is accepted by `run`, `arun`, `chat`, and `stream_chat`. A per-run tracer is used for that call only — a single `tracing=True` never enrolls later runs.
***
## What a trace contains
Each run produces one trace and a small tree of spans:
| Span | One per | What it records |
| ------------ | ---------- | ------------------------------------------------------------------------ |
| `agent` | run | Agent name, model, final output, status, total tokens |
| `generation` | model call | The exact messages sent, the reply, requested tool calls, tokens, timing |
| `function` | tool call | Tool name, arguments, return value, timing, and the error if it raised |
Because a `generation` span keeps the request as it was actually sent, you can see the conversation the model saw at every turn — the part that is hardest to reconstruct after the fact.
A run that ends in `max_turns` or `failed` is traced with that status rather than dropped, which is usually the run you most wanted to see.
***
## Environment variables
Authenticates trace uploads to Celesto. Holding the key does not by itself
enable tracing - you also pass `enable_tracing=True` or `tracing=True`.
Celesto API base URL, for self-hosted or private deployments. Traces are posted to `{CELESTO_BASE_URL}/traces/ingest`.
***
## Configure the tracer yourself
Build a tracer with `setup_celesto_tracing` and pass it to the agent. Use this to send traces somewhere other than the default endpoint, or to hold one tracer across several agents:
```python theme={null}
import os
from agentor import Agentor
from agentor.tracer import setup_celesto_tracing
tracer = setup_celesto_tracing(
endpoint="https://api.celesto.ai/v1/traces/ingest",
token=os.environ["CELESTO_API_KEY"],
timeout=10.0,
)
agent = Agentor(
name="Support Agent",
model="gpt-5-mini",
tracer=tracer,
)
result = agent.run("Summarize the latest support tickets.")
```
Celesto trace ingest URL.
Bearer token used to authenticate the upload.
How long to wait for the upload, in seconds.
An explicit `tracer=` turns tracing on for the agent, so `enable_tracing=` is not needed alongside it.
A tracer is a plain object, safe to share between agents, and it needs no shutdown or flush call. Each run uploads its own trace when it finishes.
***
## Good to know
Agentor collects a run's events in memory and posts them once, after the run finishes. There is no background batch worker and nothing to flush before your script exits.
If the upload fails — network down, wrong token, endpoint unreachable — the failure is logged as a warning and your agent still returns its answer. Turn on `logging.basicConfig(level=logging.WARNING)` to see those messages.
If you iterate `stream_chat()` and break out early, the run never finishes and its trace is not exported. `run()` and `arun()` always drain, so they always export.
Set `trace_group_id` and `trace_metadata` on the agent to tag every trace it produces. Traces sharing a `group_id` are grouped together in the dashboard, and metadata comes along for filtering and search.
```python theme={null}
agent = Agentor(
name="Support Agent",
model="gpt-5-mini",
enable_tracing=True,
trace_group_id="session-42",
trace_metadata={"env": "prod", "customer": "acme"},
)
```
Both are optional and default to `None`.
***
## Security considerations
Traces include model inputs and tool outputs. Nothing is sent unless you ask
for it, so the safe default needs no action. Where a particular run must not
leave the process, pass `tracing=False` on that call - it overrides an agent
configured with `enable_tracing=True`.
***
## Troubleshooting
* Confirm `CELESTO_API_KEY` is set in the same environment that runs the agent.
* Confirm you opted in: tracing is off unless you pass `enable_tracing=True`, an explicit `tracer=`, or `tracing=True` on the call.
* Check no `tracing=False` is being passed on the run.
* If you use a private deployment, check `CELESTO_BASE_URL` points at your Celesto API.
* Enable warning logs — a failed upload is reported there rather than raised.
Tool spans come from tool calls. If the model answered without calling anything, there is nothing to show. Check the `generation` span to see which tools were offered.
***
## Next steps
The same events that make traces can be saved to disk and replayed.
Read token usage and tool history straight off a run result.
Tracing is opt-in. A trace carries prompts, tool arguments, and tool results, so nothing leaves your process until you ask for it — a Celesto API key alone does not enable it.
***
## Quick setup
Add your Celesto API key to the environment. Get one from the [Celesto dashboard](https://celesto.ai/dashboard).
```bash theme={null}
export CELESTO_API_KEY="cel_..."
```
Pass `enable_tracing=True` when building the agent. Every run it makes is then recorded.
```python theme={null}
from agentor import Agentor
agent = Agentor(
name="Support Agent",
model="gpt-5-mini",
enable_tracing=True,
)
result = agent.run("Summarize the latest support tickets.")
```
Agentor raises with a clear message if `enable_tracing=True` is set without `CELESTO_API_KEY`, rather than silently doing nothing.
Open [celesto.ai/observe](https://celesto.ai/observe) and confirm the trace appears.
You should see one trace per run, with a span for each model call and each tool call.
## Trace one run
`tracing=` on the call overrides whatever the agent was built with. Use it to exempt a sensitive input from an otherwise-traced agent, or to record a single call from an agent that normally does not:
```python theme={null}
# Agent has tracing on — skip this one call.
agent.run("Contains customer data", tracing=False)
# Agent has tracing off — trace just this call.
debug_agent = Agentor(name="Debug", model="gpt-5-mini")
debug_agent.run("Why is this failing?", tracing=True)
```
Pass `None` (the default) to keep the agent's configuration. `tracing=` is accepted by `run`, `arun`, `chat`, and `stream_chat`. A per-run tracer is used for that call only — a single `tracing=True` never enrolls later runs.
***
## What a trace contains
Each run produces one trace and a small tree of spans:
| Span | One per | What it records |
| ------------ | ---------- | ------------------------------------------------------------------------ |
| `agent` | run | Agent name, model, final output, status, total tokens |
| `generation` | model call | The exact messages sent, the reply, requested tool calls, tokens, timing |
| `function` | tool call | Tool name, arguments, return value, timing, and the error if it raised |
Because a `generation` span keeps the request as it was actually sent, you can see the conversation the model saw at every turn — the part that is hardest to reconstruct after the fact.
A run that ends in `max_turns` or `failed` is traced with that status rather than dropped, which is usually the run you most wanted to see.
***
## Environment variables
Authenticates trace uploads to Celesto. Holding the key does not by itself
enable tracing - you also pass `enable_tracing=True` or `tracing=True`.
Celesto API base URL, for self-hosted or private deployments. Traces are posted to `{CELESTO_BASE_URL}/traces/ingest`.
***
## Configure the tracer yourself
Build a tracer with `setup_celesto_tracing` and pass it to the agent. Use this to send traces somewhere other than the default endpoint, or to hold one tracer across several agents:
```python theme={null}
import os
from agentor import Agentor
from agentor.tracer import setup_celesto_tracing
tracer = setup_celesto_tracing(
endpoint="https://api.celesto.ai/v1/traces/ingest",
token=os.environ["CELESTO_API_KEY"],
timeout=10.0,
)
agent = Agentor(
name="Support Agent",
model="gpt-5-mini",
tracer=tracer,
)
result = agent.run("Summarize the latest support tickets.")
```
Celesto trace ingest URL.
Bearer token used to authenticate the upload.
How long to wait for the upload, in seconds.
An explicit `tracer=` turns tracing on for the agent, so `enable_tracing=` is not needed alongside it.
A tracer is a plain object, safe to share between agents, and it needs no shutdown or flush call. Each run uploads its own trace when it finishes.
***
## Good to know
Agentor collects a run's events in memory and posts them once, after the run finishes. There is no background batch worker and nothing to flush before your script exits.
If the upload fails — network down, wrong token, endpoint unreachable — the failure is logged as a warning and your agent still returns its answer. Turn on `logging.basicConfig(level=logging.WARNING)` to see those messages.
If you iterate `stream_chat()` and break out early, the run never finishes and its trace is not exported. `run()` and `arun()` always drain, so they always export.
Set `trace_group_id` and `trace_metadata` on the agent to tag every trace it produces. Traces sharing a `group_id` are grouped together in the dashboard, and metadata comes along for filtering and search.
```python theme={null}
agent = Agentor(
name="Support Agent",
model="gpt-5-mini",
enable_tracing=True,
trace_group_id="session-42",
trace_metadata={"env": "prod", "customer": "acme"},
)
```
Both are optional and default to `None`.
***
## Security considerations
Traces include model inputs and tool outputs. Nothing is sent unless you ask
for it, so the safe default needs no action. Where a particular run must not
leave the process, pass `tracing=False` on that call - it overrides an agent
configured with `enable_tracing=True`.
***
## Troubleshooting
* Confirm `CELESTO_API_KEY` is set in the same environment that runs the agent.
* Confirm you opted in: tracing is off unless you pass `enable_tracing=True`, an explicit `tracer=`, or `tracing=True` on the call.
* Check no `tracing=False` is being passed on the run.
* If you use a private deployment, check `CELESTO_BASE_URL` points at your Celesto API.
* Enable warning logs — a failed upload is reported there rather than raised.
Tool spans come from tool calls. If the model answered without calling anything, there is nothing to show. Check the `generation` span to see which tools were offered.
***
## Next steps
The same events that make traces can be saved to disk and replayed.
Read token usage and tool history straight off a run result.